Source: Investing
Author: XM Group
Article: Original article
Publication date: Wednesday, December 7, 2022
The USD/JPY has been in a long uptrend for nearly two years, hitting a 32-year high of 151.94 in October. However, the pair has declined moderately, with the 200-day simple moving average (SMA) currently acting as a strong floor.
Currently, the momentum indicators are confirming the bearish force. Particularly, the RSI is fluctuating below its 50-neutral mark, while the stochastic oscillator is declining after a bearish cross.
If buying forces increase, the pair could challenge the recent 137.96 resistance area.
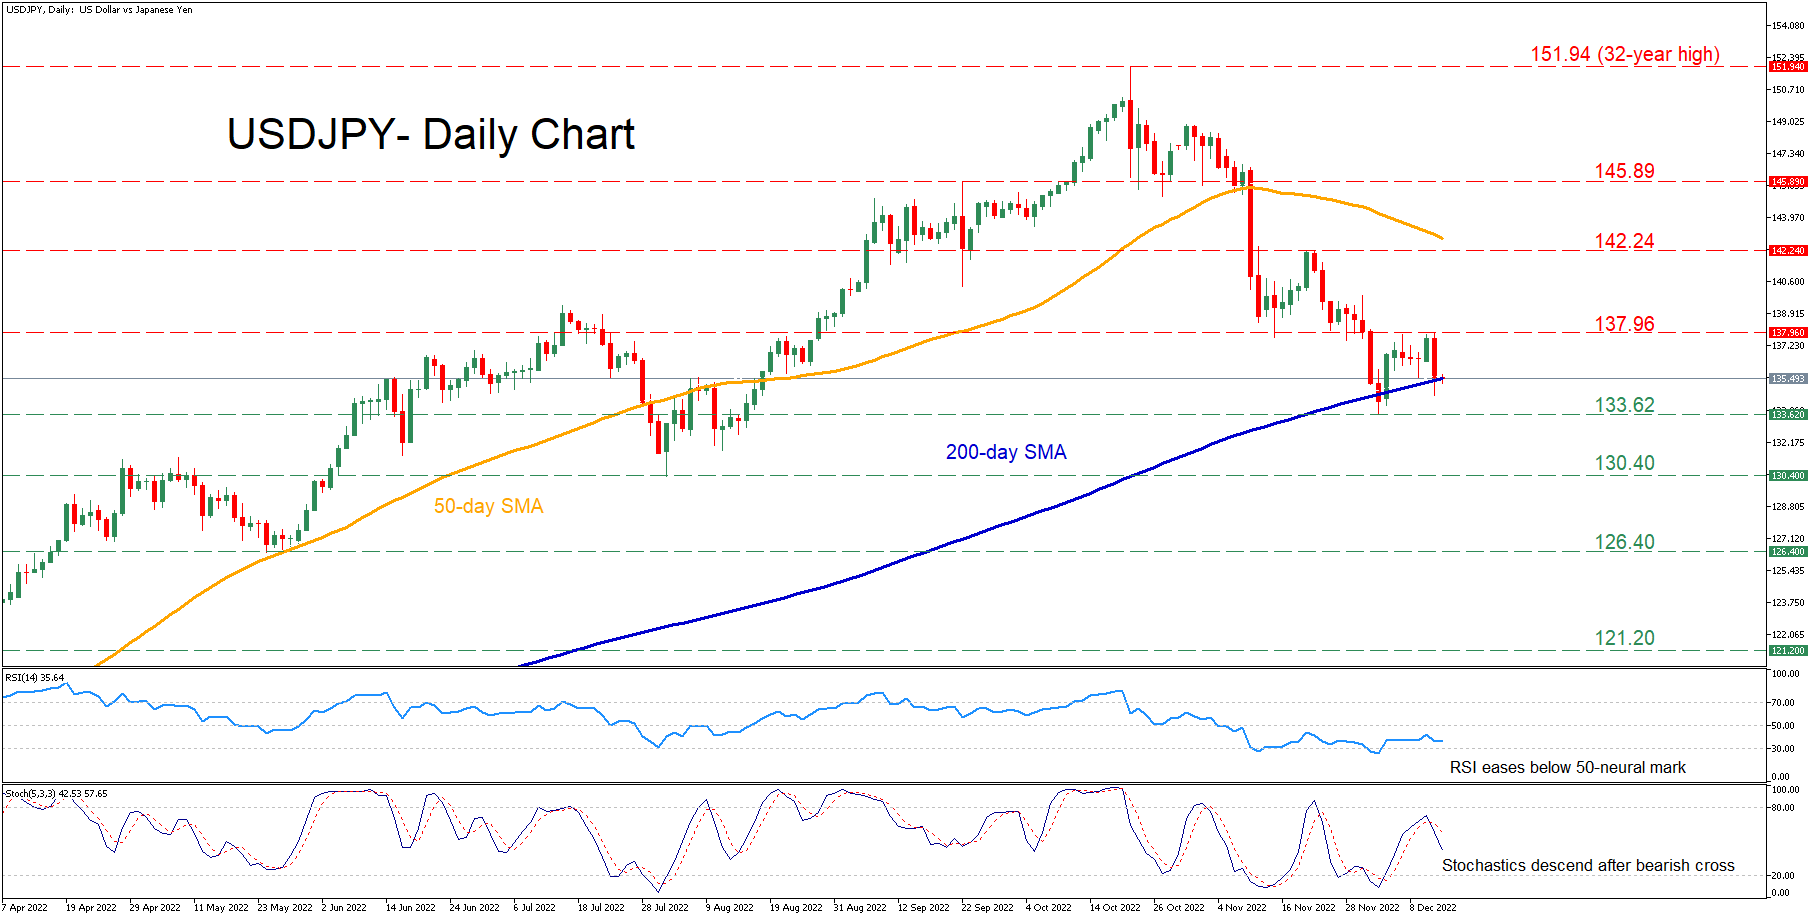
USD/JPY daily chart
Despite the constant downward pressure, it looks like the USDJPY cannot break down the essential 200-day SMA. Therefore, if the pair continues its unsuccessful break-down attempts, an upside correction may occur.
Forecast: USD/JPY reversal
This content is for informational purposes only and is not intended to be investing advice.
